Discover TÜV-certified GoogleTest with Agentic AI for C/C++ testing! Get the Details »

Explore the Chapters
Parasoft’s extensive reporting capabilities bring the results of Parasoft C/C++test and C/C++test CT into context. Test results can quickly be accessed within the IDE or exported into the web-based reporting system, DTP.
In DTP, reports can be automatically generated as part of CI builds and printed for code audits in safety-critical organizations. Results from across builds can be aggregated to give the team a detailed view without requiring access to the code within their IDE.
In the reporting dashboard, Parasoft’s Process Intelligence Engine (PIE) helps managers understand the quality of a project over time. It illustrates the impact of change after each new code change. Integrating with the overall toolchain, PIE provides advanced analytics that pinpoint areas of risk.
Parasoft C/C++ testing solutions help teams efficiently understand results from software testing by reporting and analyzing results in multiple ways. Directly in the developer’s IDE, users can view:
The Quality Tasks view in the IDE makes it easy for developers to sort and filter the results, for example group per file, per rule, or per project. Developers can make annotations directly in the source code editors to correlate issues with the source code. This provides context and more details about reported issues and how to apply a fix. Code coverage information is presented with visual green and red highlights displayed in the code editor, together with percentage values (for project, file, and function) in a dedicated Coverage view.
Analysis results for both IDE and command-line workflows can also be exported to standard HTML and PDF reports for local reporting. For safety-critical software development, C/C++test provides an additional dedicated report format. It details unit test case configuration and includes the log of results from test execution. Users get a complete report of how the test case was constructed and what happened during runtime.
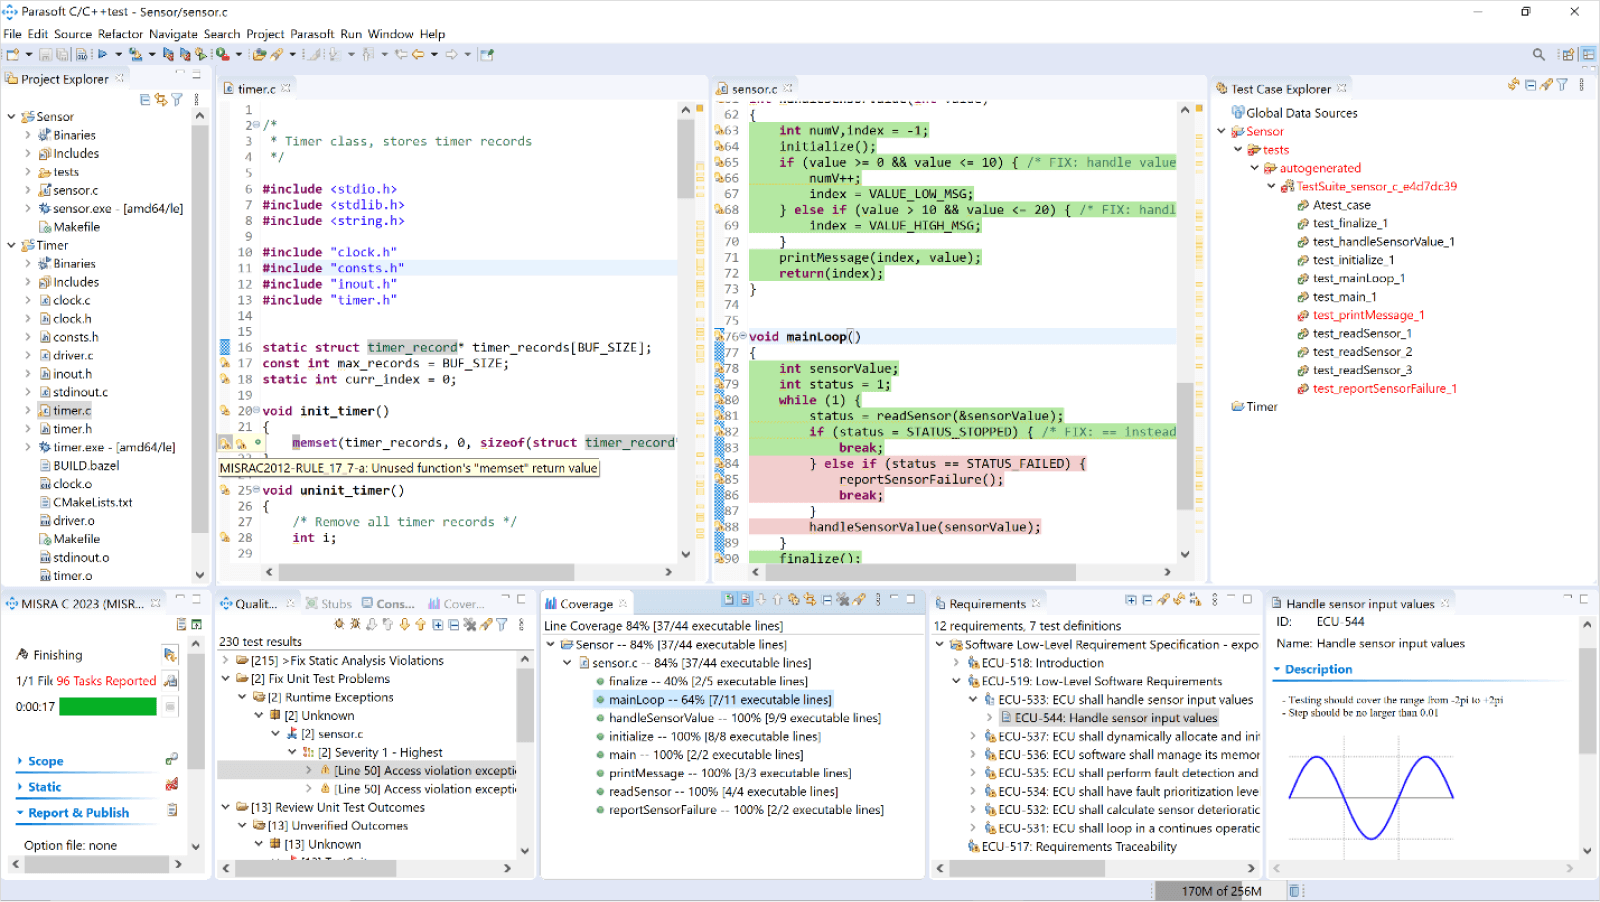
Parasoft C/C++test unified testing view
For team collaboration, Parasoft C/C++test and C/C++test CT publish analysis results to DTP, a centralized server. Developers can access test results from automated runs and project managers can quickly assess the quality of the project. Reported results are stored with a build identifier for full traceability between the results and the build. Those results include:
When integrating into CI/CD workflows, Parasoft users benefit from a centralized and flexible web-based interface for browsing results. The dynamic web-based reporting dashboard includes customizable reporting widgets, source code navigation, advanced filtering, and advanced analytics from Parasoft’s Process Intelligence Engine. Users can access historical data and trends, apply baselining and test impact analysis, and integrate with external systems like those for test requirements traceability.
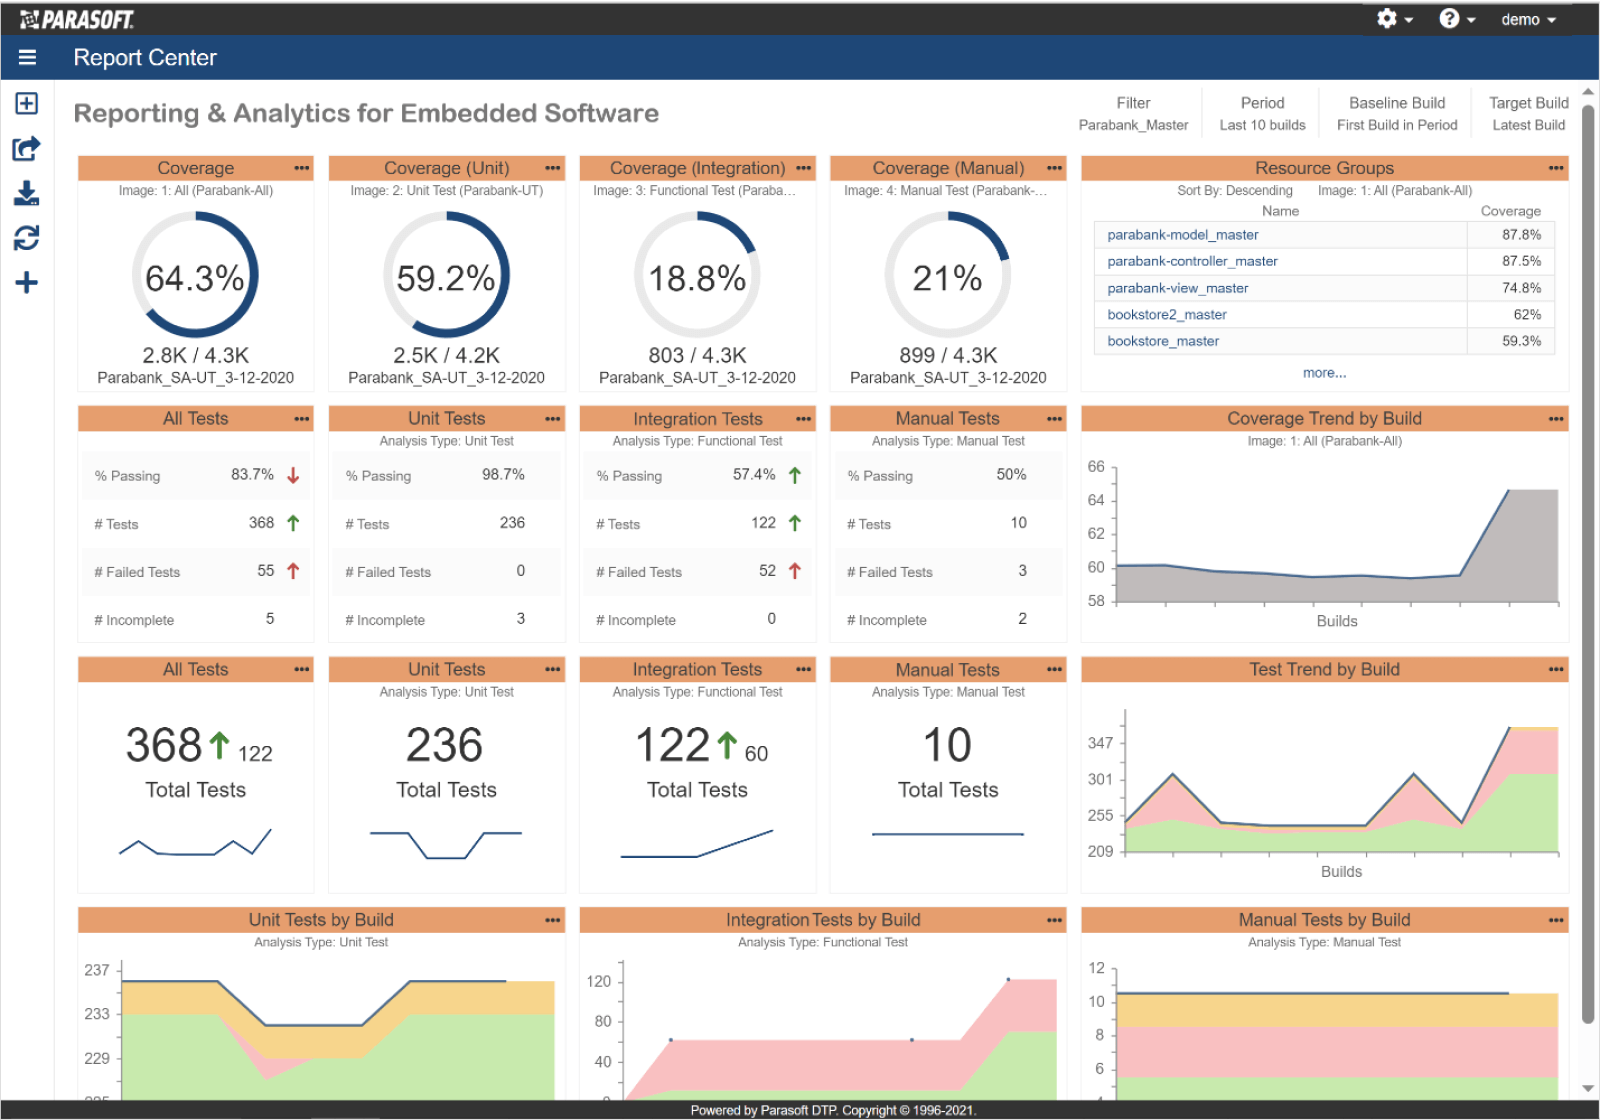
Centralized web-based reporting and analytics dashboard
Each and every test performed, including manual, system level, and UI-based, is recorded for test/fail results, along with their coverage impact on the code base. Each additional test is overlaid on this existing information, creating a complete picture of test success and coverage.
As code is changed, the impact is clearly visible on the underlying record, highlighting tests that now fail or code that is now untested. Raising this information in various degrees of detail allows developers and testers to quickly identify what needs to be altered or fixed for the next test run.
There are various coverage metrics to consider. Knowing which specific type to apply depends on the software integrity level (ASIL) as defined in ISO 26262.
For automotive systems, the control metrics referenced are statements, branch, and modified condition decision coverage (MC/DC). For the strictest requirements, there’s object/assembly code. Parasoft supports gathering all these coverage metrics, including terms other industries use like block, call, function, path, decision, and more.
In addition to change impact analysis, static analysis can be used to highlight areas of the code that appear riskier than others. Risk can take a variety of forms including:
These are areas of code that may require additional test coverage and even refactoring.
Parasoft C/C++ testing solutions provide specific reporting capabilities suited to functional safety development. Here are two report examples:
The ISO26262 Compliance Pack provides a dedicated, standard-driven report template to help teams comply with industry standards and provide automatically generated reports required for code audits.
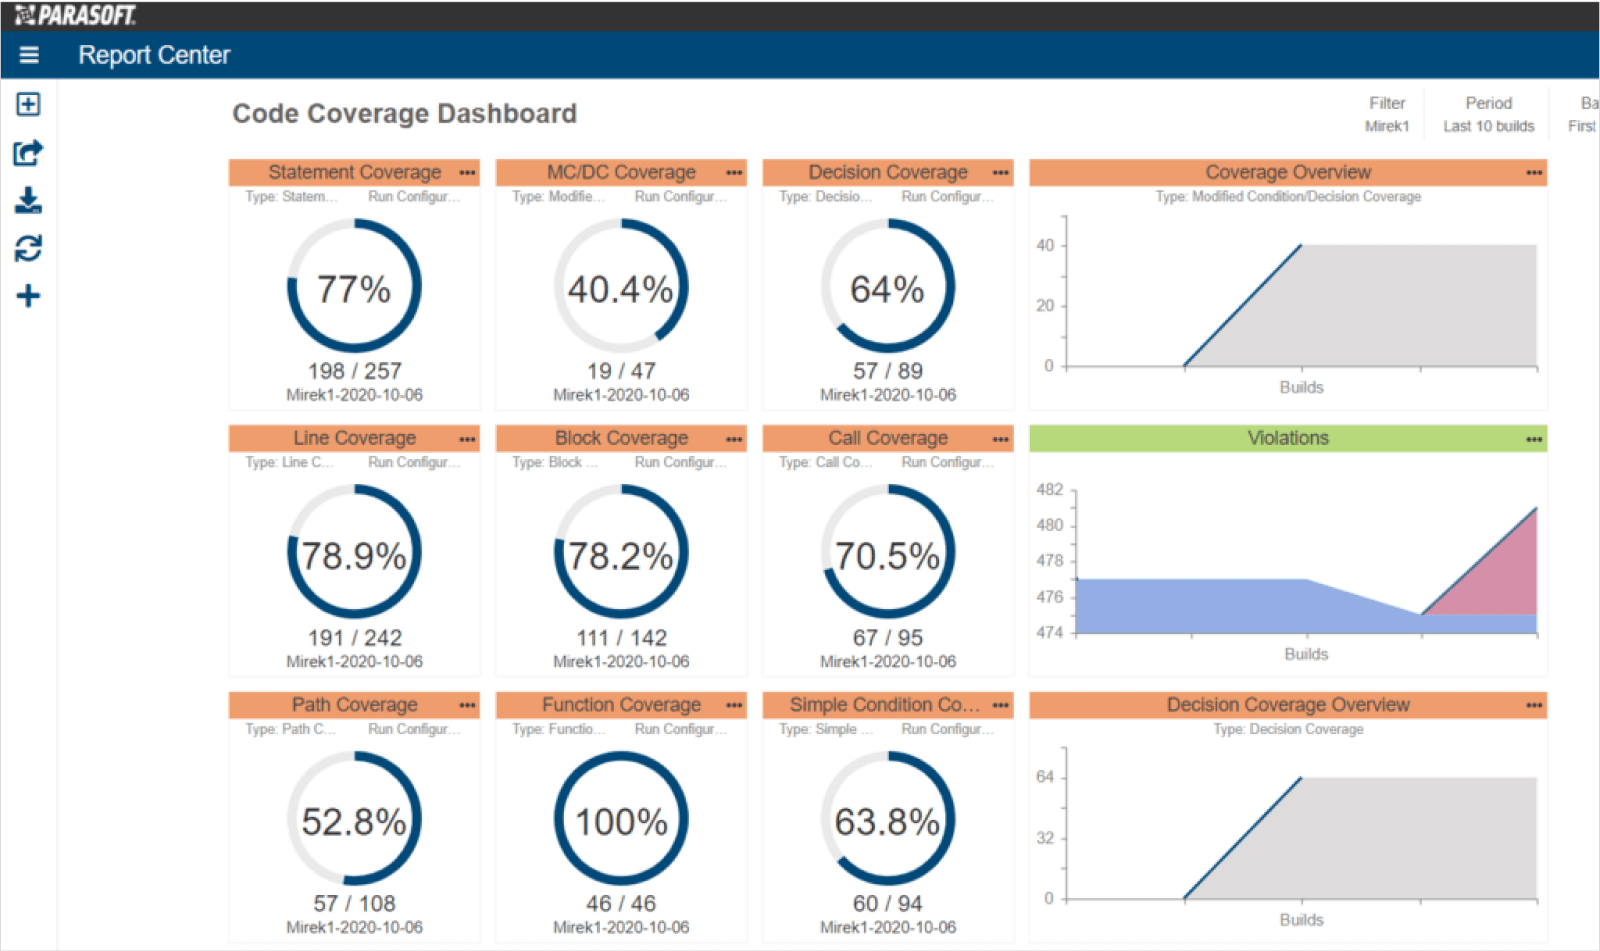
Individual code coverage metrics are available within the reporting dashboard.
Parasoft DTP is highly customizable and supports user-configured custom processors for project-specific analysis, custom widgets, and dashboards.
Instead of just providing static analysis checkers with basic reporting and trends visualization, Parasoft’s solution for coding standards compliance provides a complete framework for building a stable and sustainable compliance process.
In addition to standard reporting, Parasoft provides a dedicated compliance reporting module that gives users a dynamic view into the compliance process. Users can see results grouped according to categorizations from the original coding standard, manage the deviations process, and generate compliance documents required for code audits and certification as defined by the MISRA Compliance:2020 specification.
With a unified reporting framework, Parasoft C/C++test and C/C++test CT efficiently provide multiple testing methodologies required by the functional safety standards such as static analysis, unit testing, code coverage, and requirements traceability.
By presenting cumulative results from the multiple testing techniques, Parasoft provides consistent reporting that reduces the overhead of testing activities. The analytics, reports, and dashboards:
Simplify code audits and the certification process.
Eliminate the need for users to manually process reporting to build documentation for the certification process.
Focus testing efforts where needed by eliminating extraneous testing and guesswork from test management.
Reduce the costs of testing while improving test outcomes with better tests, more coverage, and streamlined test execution.
Minimize the impact of changes by efficiently managing the change itself.
Parasoft’s Process Intelligence Engine enables users to look at the changes between two builds to understand, for example, the level of code coverage or static analysis violations on the code that has been modified between development iterations, different releases, or an incremental development step from the baseline set on the legacy code.
Teams can converge on better quality over time by improving test coverage, reducing the potential risky code. The technical debt due to untested code, missed coding guidelines and potential bugs and security vulnerabilities can be reduced gradually build by build. Using the information provided by Parasoft tools, teams can focus in on the riskiest code for better testing and maintenance.

Explore the Chapters