Discover TÜV-certified GoogleTest with Agentic AI for C/C++ testing!
Get the Details »
Parasoft Blog

Performance testing is increasingly becoming part of the continuous delivery pipeline in DevOps settings. Here, we talk about performance testing and the best ways to include load and performance testing in the delivery of applications.
Jump to Section
Modern software applications must rapidly respond to changing business requirements as well as quickly fix bugs, performance issues, and security issues to stay competitive. However, in a traditional development environment the time it takes to thoroughly test a software application before its release comes conflicts with the pace with which the application needs to evolve.
DevOps methodologies have proven effective in reconciling these conflicting requirements of rapidly releasing and delivering high software quality. For this reason, they’ve gained wide adoption in forward-looking software development organizations.
DevOps widely uses the concept of continuous process, which applies to all stages of the application lifecycle, including modifying code, application testing, and deployment and production monitoring. While continuous unit and integration testing practices have gained wide adoption, continuous performance testing has been notably lagging behind, largely because of organizations’ struggle to fit traditionally manual performance testing into a highly automated DevOps pipeline. In this article we’ll describe how performance testing needs to change to become an integral part of the DevOps environment.
Applications can fail in multiple ways. To catch errors, software development and QA employ multiple types of tests. The most common include the following.
Each of these test types addresses a specific category of failures an application can experience in production. Performance tests, which are the subject of this article, target a set of failure types that occur when the application is put under a load of concurrent requests. Below are the six most common of these failure types.
Each of these failures is capable of causing financial losses and damaging the organization’s reputation as a reliable service provider. Below, we’ll look at steps on how to integrate performance tests into the DevOps pipeline to catch these issues early.
You can start integrating performance tests into the continuous delivery pipeline by adding selected performance tests to Jenkins, or a continuous integration tool of your choice, and having them run regularly.
Depending on your needs, you can run performance tests at one or more of the following points during the build or test of the infrastructure.
This by itself, however, is not enough.
Manually analyzing load test reports can be time-consuming and may require special skills not every developer possesses. Without the ability to automate load test report analysis, reviewing performance test results becomes a tedious time sink. Vital performance information may also get overlooked. In such scenarios, you may be running performance tests continuously, but the benefit of them will be limited.
To get the full benefit of continuous performance testing, you need to set up an effective mechanism to analyze performance test results. Parasoft LoadTest and its LoadTest Continuum, a module of Parasoft SOAtest, provide you with tools that help automate the collection and analysis of performance test results and give you insights into the performance of your application.
The following steps will help you set up your environment for continuous performance test execution with Parasoft LoadTest and LoadTest Continuum:
Let’s go through these steps individually in more detail below.
Parasoft LoadTest Quality of Service (QoS) metrics are one of the key features for automating the analysis of performance test results. QoS metrics reduce large amounts of data in a load test report to a set of success/failure answers about your application performance. Parasoft LoadTest offers a rich set of QoS metrics that range from ready-to-use threshold metrics to custom-scripted metrics that allow you to use the LoadTest API for advanced load test data analysis.
To prepare your performance tests for automation, you need to review the QoS metrics in your LoadTest projects. Run a LoadTest project and examine the report: all success and failure criteria that you use to manually analyze a load test report should be represented as QoS metrics. Convert as many metrics as you can into "numeric" metrics. A numeric QoS metric not only returns a success/failure result, but also quantifies a key performance indicator for that metric. For instance, a metric that validates a CPU utilization threshold would also provide the actual CPU utilization value as a numeric metric.
Numeric metrics are widely used in LoadTest Continuum to plot metric performance over time:
Numeric metric results plotted in a LoadTest Continuum report.
Once you’ve configured the QoS metrics for your LoadTest projects, it’s time to set up the LoadTest Continuum for performance data collection and analysis.
Deploy and configure the LoadTest Continuum ltc.war Web application archive (available in the SOAtest/LoadTest install directory starting with version 9.10.2), as described in the "LoadTest Continuum" section of the LoadTest documentation.
Combine your LoadTest projects into .cmd scripts for batch execution. LoadTest .cmd scripts are how you can specify groups of projects that will make up different sets of performance tests, such as the "smoke" tests, daily tests, or weekend tests mentioned previously.
Configure the .cmd scripts to send report data to LoadTest Continuum as described in the "Sending Reports to LoadTest Continuum" section of the LoadTest documentation. Set up your continuous integration tool to run LoadTest .cmd scripts as a part of a build process or at regular intervals. For instance, in Jenkins you can run a LoadTest .cmd script using Execute Windows batch command build step as follows:
%SOATEST_HOME%lt.exe" -J-Xmx4096M -cmd -run "%WORKSPACE%ltcontinuum.cmd
Parasoft DTP contains reporting and analytics dashboards that enable you to monitor the health and progress of your software project with a variety of widgets and reports.
A Parasoft LoadTest Continuum DTP widget allows you to add the most recent LoadTest results summary to your DTP project dashboard and offers a quick way to evaluate the state of the performance test results in your daily project state review routine.
The widget displays the number of total, passed, and failed tests and metrics for the most recent LoadTest runs. To view the results in more detail, click on the project link in the widget, and the LoadTest Continuum page will open in a new tab.
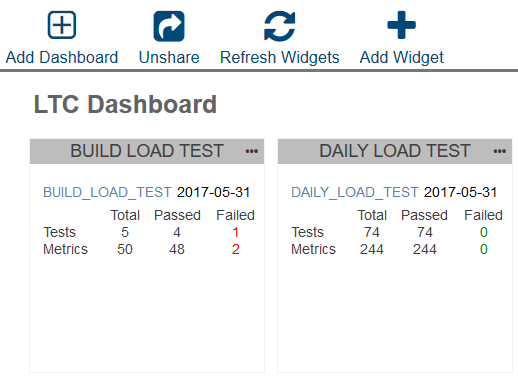
LoadTest Continuum widgets in a DTP dashboard.
To set up a LoadTest Continuum Custom HTML Widget in DTP, you can simply follow these steps:
Parasoft LoadTest Continuum serves as both a collection point for your LoadTest reports and an analysis tool that organizes load test data from multiple runs. LoadTest Continuum organizes the data into a pyramid of information that allows you to review your performance test results at various levels of detail, from high-level daily summaries at the top, to QoS metrics results at the core, to detailed load test reports at the bottom:
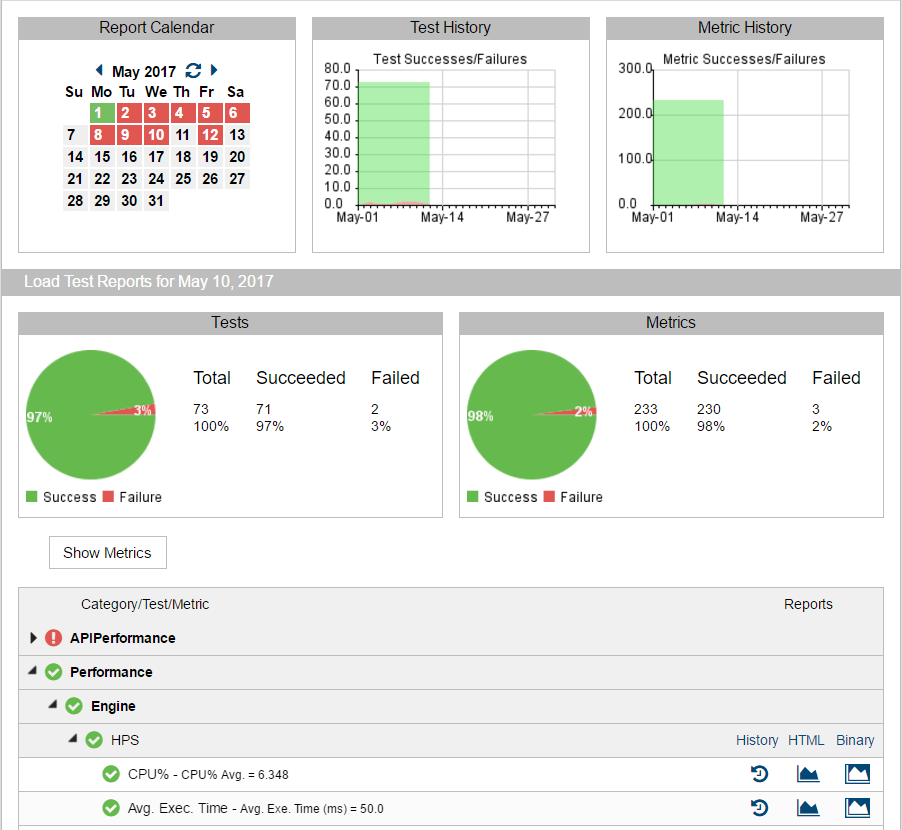
The LoadTest Continuum daily summary and test metrics view.
Consider the following workflow as an example of a regular (daily) test review:
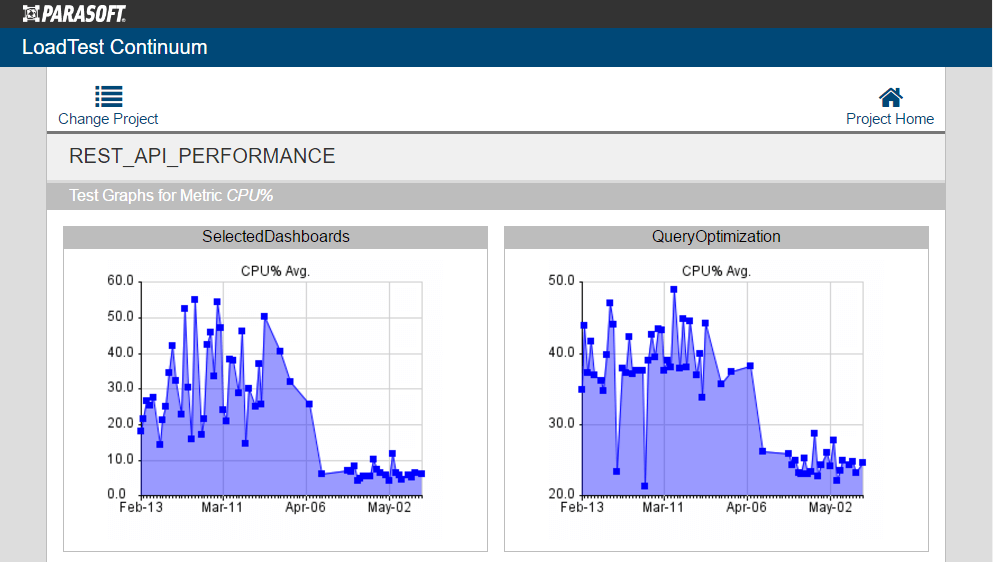
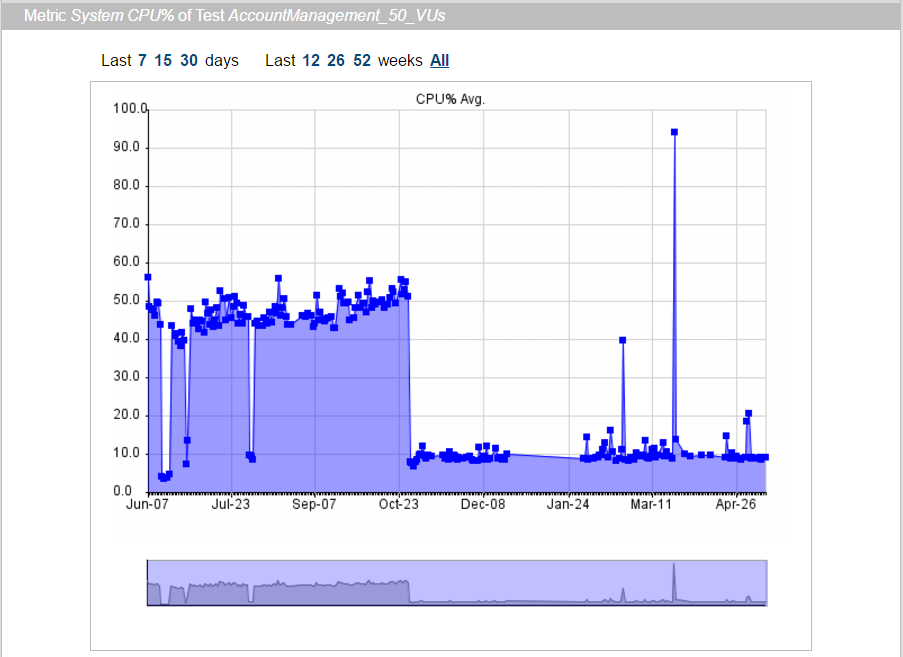
Load Test Continuum All graphs of the same metric view show performance improvement of the CPU% metric across multiple tests.
Integrating a performance testing process into the continuous delivery pipeline is essential to ensure software quality. To get the full benefit of this process you need to set up an effective mechanism for performance test results analysis automation.
Achieve all of your lofty test result analysis automation goals with Parasoft LoadTest and LoadTest Continuum inside of Parasoft SOAtest. These tools offer sophisticated automation within functional testing, so you can deliver higher quality software.
How to Optimize Performance Testing With a Shift-Left Approach


