Discover TÜV-certified GoogleTest with Agentic AI for C/C++ testing! Get the Details »
Parasoft Blog


Visual Studio Code is a popular IDE. However, configuration tasks can sweep great developers off their feet. One of such is configuring the VS Code extension for C/C++ status analysis. Check out this post to learn a proven way to achieve that.
Jump to Section
In this blog post, I’ll share a couple of hints with you about configuring and using our brand new C/C++test static analysis extension for the Visual Studio Code editor.
The popularity of the Visual Studio Code (VS Code) editor is growing at a rapid pace. In the latest Stack Overflow Annual Developer Survey, VS Code dominated the Development Environments and Tools category.
It’s fast, simple, customizable, extensible, and runs on the three leading development platforms: Windows, Linux, and Mac. Its popularity is not limited to the teams developing with JavaScript or TypeScript. We often see it in use for developing safety-critical C/C++ software.
VS Code is supported by a vast ecosystem of extensions available through the marketplace. However, there is a limited number of extensions for C/C++ static analysis.
Until the 2020.1 release of the Parasoft C/C++test in April, there was nothing that could help you to comply with MISRA, CERT, and AUTOSAR C++ coding standards without a need to leave the editor to check the results. I mean the full standards support, Clang-Tidy, is cool but it covers only a fraction of these standards.
We decided to fill this gap and provide an extension for this great editor to help check the code you just wrote against your preferred coding standard, review the results, and fix or suppress them — all inside the VS Code.
In this post, I’m focusing on the static analysis for C/C++ but we also support C# with static analysis extension for Parasoft dotTEST.
The easiest way to get up and running with Parasoft static analysis extension for the Visual Studio Code editor is via the Microsoft Marketplace.
Start VS Code and go to Extensions (Ctrl + Shift + X). In the search field, type "C++test" and install the extension.
After the installation, the extension will welcome you with the following message:

The message informs that in order to run the static analysis with the VS Code extension you need to download the C/C++test Standard, which is the command line static analysis engine that is used by the C/C++test Visual Studio Code extension.
After downloading the C/C++test Standard distribution simply unpack it to any directory you like and install the trial (or full) license. Your license needs to contain the command line feature. You can install the license by editing the cpptestcli.properties file located in the main directory of the distribution or place the cpptestcli.properties file in your home directory and put the licensing information there.
For our experiment here, let’s use the Timer example project that is shipped with C/C++test. In the VS Code, switch to Explorer and use "Add folder to workspace …" to add the <C/C++test install dir>/examples/Timer folder to your workspace.
To perform the simple configuration of the extension, click the C/C++test quick start in status bar:

You’ll see these configuration options:

Set them as follows:
For your real projects, there’s one more setting you may need to configure to start using static analysis. We’ll get to it later. For now with these settings made, select the Timer folder in Explorer.
From the context menu, select "C/C++test: Analyze Selected File(s) …". The OUTPUT panel will start showing the information about subsequent steps of the static analysis.
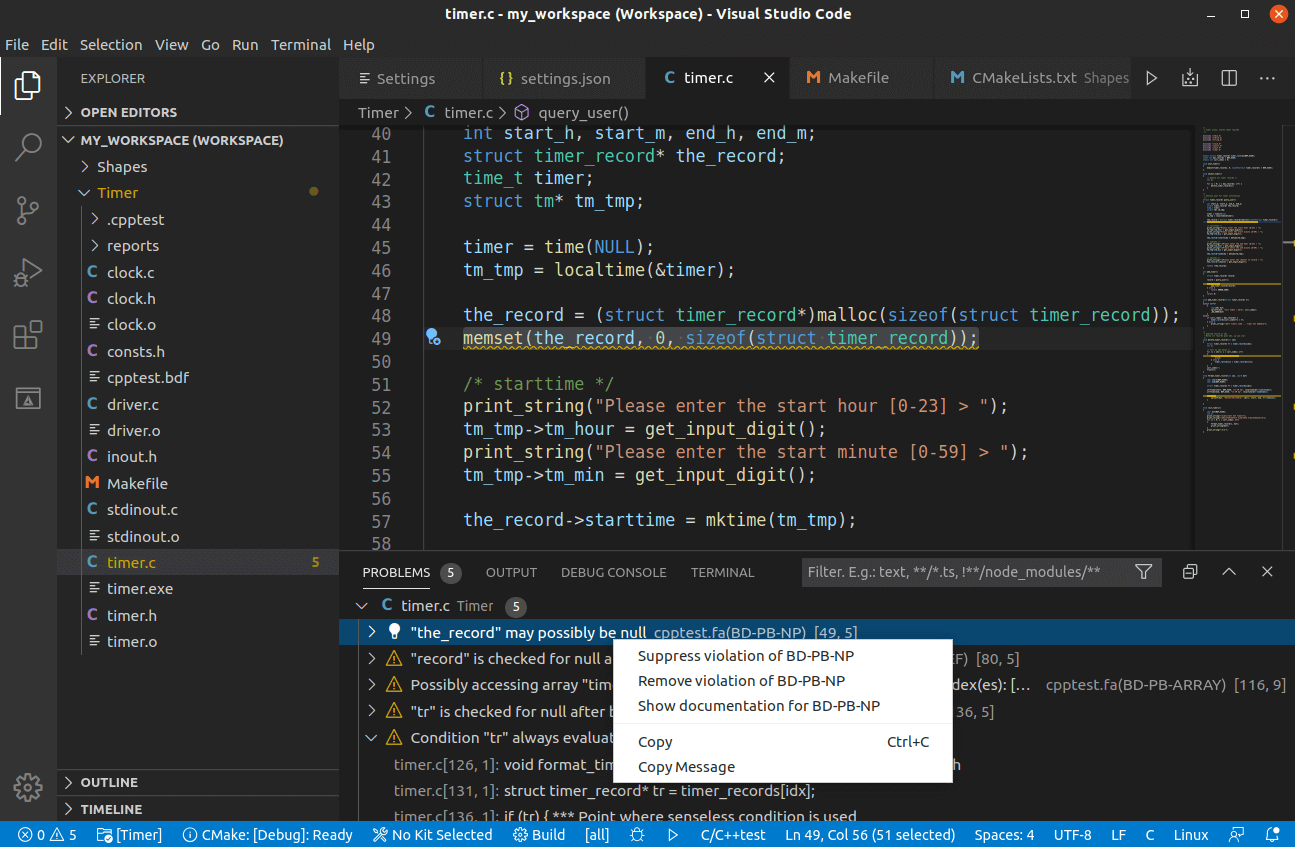
Once the analysis is done, the PROBLEMS panel will display all the findings reported by the static analysis. It should look like below:

You can analyze the findings by clicking on the lines in the PROBLEMS panel. When you select a finding, the C/C++test extension will take you to the source code where you can see why the problem is reported.
If the reason is not clear, right-click on the finding in the PROBLEMS panel and choose "Show the documentation for <static analysis rule>". It will show you the detailed description.
If you prefer to ignore the finding, right-click and choose "Suppress violation of <rule>". This operation will add a special comment to your source file, which will stop the analyzer from reporting this finding in the future.
Or you can "Remove violation of <rule>" from the view and not bother about it in this run. These menu options are shown in the image above.
I mentioned that for your real projects you may need to configure one more option to start working with the static analysis. This is about the build information, more specifically, compilation command lines.
The static analysis engine needs to know the compilation command lines for each file that is going to be analyzed. Depending on how your project is built, you can apply different strategies for providing this information.
Let’s see how it happened for our Timer example.
Switch to the OUTPUT panel, which should still contain the output from our analysis run.
Scroll all the way up. In the second line of the output you should see the command line for C/C++test Standard that was executed by the extension. It will start with "cpptestcli". The interesting part is at the end of this command line.

In this case, the C/C++test static analysis engine was told to "trace" the build to get the compilation command lines information it needs. You can apply this strategy for other build systems as well. It works nicely:
Cpptestcli executes the build command that is specified after the -trace option. The build information is automatically scanned and saved into the cpptest.bdf file, which is now visible in the "Timer" folder and used as an input for the static analysis.
All great, but what happens if I want to rerun the static analysis? Well, with the default settings, C/C++test will rerun your build. Not a good option for the real projects.
Here’s how you can change it.
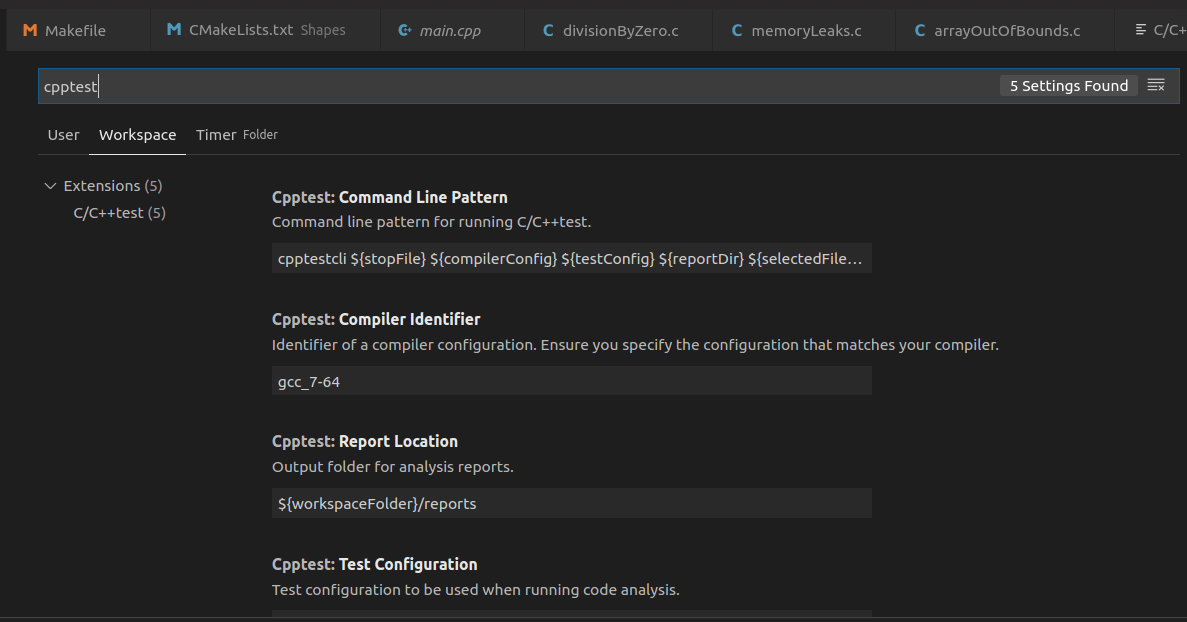
You’ll see the extension settings like shown here:

The build information configuration is a part of the Command Line Pattern setting. In the settings panel, select Timer (next to User and Workspace) to modify the settings only for the Timer folder.
Go to the Command Line Pattern, move to the end, and customize the pattern to replace "-trace make clean all" with "-input ${workspaceFolder}/cpptest.bdf" like shown below:

With this setting, whenever you run the static analysis, C/C++test will not re-execute your build process but simply load the content of the cpptest.bdf that was generated during the first build and perform the analysis much faster. You can learn more about build data files here.
For those of you who use CMake for your projects, there is one more option available to simplify the setup process. C/C++test can take the compile_commands.json file that can be automatically generated by CMake as an input for the analysis.
Configure the compile_commands.json files generation for our Timer example in this article.
When you’re finished, visit the settings panel one more time (Ctr+Shift+P, type "C/C++test: Quick Start" and select "Open settings …" or use the "C/C++test" quick start in the status bar).
Go to the Command Line Pattern field and modify it as shown below:

That’s it! You can use the file automatically generated by the CMake build and simplify your setup.
There are a couple of other interesting options and commands available in the extension, which I invite you to explore. For example, you can import the static analysis results from the file that’s generated as a part of your CI/CD pipeline and review it locally.
"MISRA", "MISRA C" and the triangle logo are registered trademarks of The MISRA Consortium Limited. ©The MISRA Consortium Limited, 2021. All rights reserved.